Case 12 / Civil aircraft performance
Honda HA420 analytical performance study
An aircraft-performance calculation study, with original report plots and an interactive example of drag, thrust margin and ideal climb potential.
Original report plots · interactive drag / power modelAnalytical aircraft-performance study
How do speed and density move the balance between drag demand and available thrust?
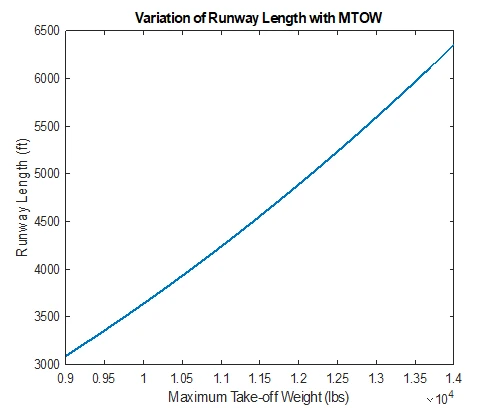
I analysed takeoff, climb and cruise performance using an analytical aircraft model. The interactive explorer shows how airspeed and density affect parasite drag, induced drag, thrust margin and ideal climb potential. The accompanying figures document the wider performance calculations.
Method and workflow
- 01
Declare the model
State weight, reference area, drag assumptions and the source density/thrust-lapse relation.
- 02
Balance lift
Calculate required lift coefficient at each speed under a steady, level-flight assumption.
- 03
Resolve drag
Separate the model’s parasite and induced contributions and compare their sum with available thrust.
- 04
Interpret excess power
Use the thrust margin and speed to inspect ideal climb potential, while exposing the chosen lift limit.
Find the thrust margin.
Required lift is within the chosen CL ≤ 1.1 assumption.
Model parameters: weight 10,701 lbf, area 176.56 ft², span 39.76 ft and 27° wing sweep. CD₀ = 0.0225, k = 0.0902. Thrust varies with density ratio raised to the power 0.6. The curves show the analytical model under these assumptions; aircraft operating limits require separate reference data.
Project figures
Model assumptions and scope
- The calculations use an analytical model with stated geometry, drag and propulsion assumptions.
- The explorer uses the climb model’s 27° sweep assumption consistently.
- Excess-power climb is an ideal estimate. Engine transients, acceleration and detailed operating limits are outside the model, and the lift limit is assumed.
Potential extensions
Verify the aircraft inputs against consistent reference conditions and compare the analytical predictions with appropriately sourced performance data.
Let’s work through it.
Robotics, simulation and control consultation across Canada, with remote support available internationally. Share your system and the result you need.