Case 04 / Machine learning & inspection
Wind-turbine defect detection
A computer-vision workflow for finding candidate defects in turbine imagery, with training metrics, validation figures and an image-by-image prediction explorer.
100 training epochs · saved validation and predictionsHow can a computer-vision model help reviewers find candidate defects in large collections of turbine imagery?
I built a YOLOv8 inspection workflow covering image preparation, model training, inference and visual review. The explorer displays saved prediction coordinates, while the training curves and validation figures show the detector’s performance on the project dataset.
Method and workflow
- 01
Prepare and label
Define dirt and damage classes, organize the imagery and inspect the annotations.
- 02
Train the detector
Fine-tune the model across 100 epochs and record validation metrics rather than relying on a few attractive predictions.
- 03
Read the errors
Compare precision, recall, mAP and the confusion matrix. Inspect missed defects and false positives.
- 04
Review predictions
Adjust the confidence threshold and examine individual candidate boxes on the original images.
Look closer.
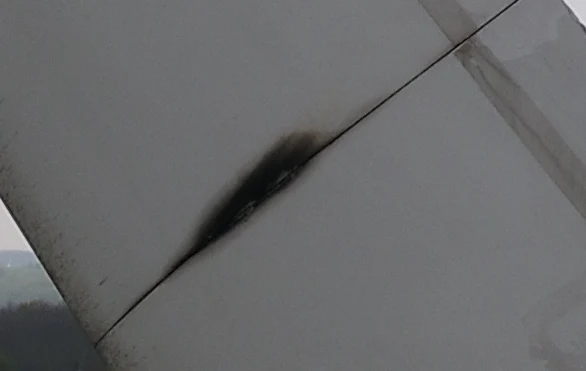
Saved model predictions, filtered interactively. Confidence is a model score; these boxes are not verified defect labels.
What changed over 100 epochs?
The lines come from the saved training CSV. Select an epoch to inspect its validation metrics.
Project figures
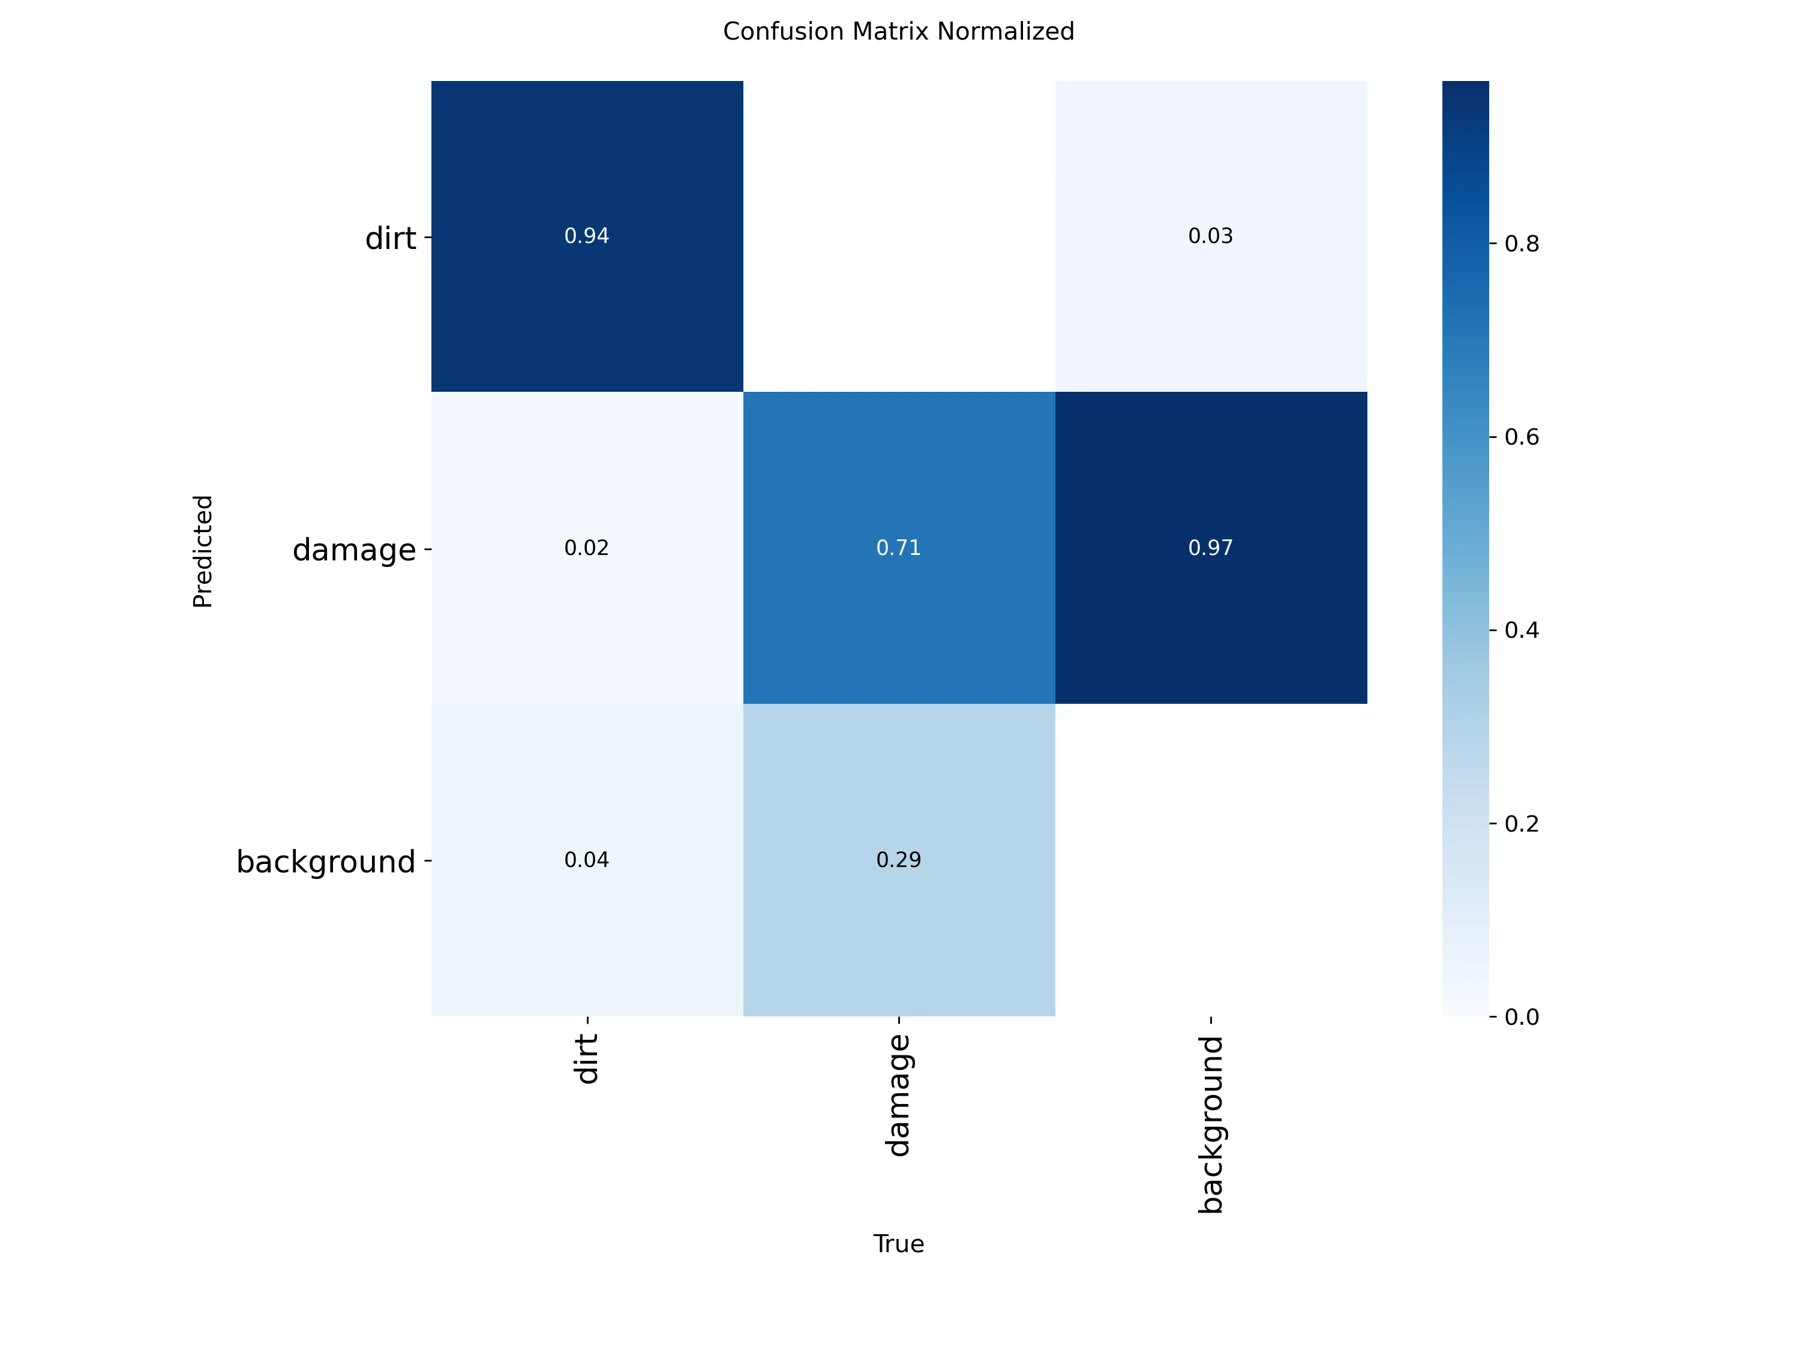
Model assumptions and scope
- The 82.3% mAP50 figure describes a saved validation run, not an independent deployment benchmark.
- Images containing detections are not the same as correctly classified images.
- Predictions assist inspection review; they do not establish structural condition or replace engineering assessment.
Potential extensions
Evaluate on a held-out turbine or inspection sequence and report class-level errors and inference hardware.
Let’s work through it.
Robotics, simulation and control consultation across Canada, with remote support available internationally. Share your system and the result you need.